Monitoring the indoor air quality in schools
Have you ever considered the impact that air quality in schools has on children’s health and their ability to learn?
Numerous reports suggest that CO2 levels consistently higher than 1500ppm are harmful to concentration and health, both of which can have a negative impact on academic performance. That’s why there are regulations around air quality in classrooms; whereby natural ventilation systems cannot exceed a daily average CO2 level of 1500ppm, and CO2 levels can reach 2000ppm for no more than 20 consecutive minutes in a given day.
BB101 states that ventilation must allow the user to monitor carbon dioxide levels within the classroom and have the ability to make changes to the ventilation system based on occupant demand.
How can we ensure that the regulations set out are met and that students are provided with comfortable learning conditions?
Our passive ventilation systems are provided with a set of controls, which allow us to set parameters to ensure a healthy and comfortable learning environment is provided. Once installed, Ventive systems connect automatically to the Ventive cloud through a mobile GSM network. Data on air quality, temperatures and operation modes are continuously sent and logged. This allowes us to review the indoor air quality and quickly build a usage profile for the building and help schools optimise ventilation performance for the best results.
We provide a white CO2 sensor which is fitted to the wall. This displays a CO2 level readings within the classroom, represented as parts per million (ppm). The screen is colour-coded to make it easy for occupants to understand the numbers and what mode the system is operating in.
- Green: CO2 levels are below 1500ppm and standard heat recovery mode is engaged
- Orange: CO2 levels are between 1500ppm and 2000ppm and bypass mode is engaged, extra dampers have been opened to increase the rate of air flow in the room
- Red: CO2 levels are above 2000ppm and purge mode is engaged, all dampers have been opened to maximise the rate of air flow and rapidly decrease the amount of CO2 in the room
Performance monitoring
Real-time performance monitoring allows us to see if the indoor air quality is within the recommended guidelines. It also allows us to see if the building is performing in the way in which it was designed. Over time, a profile can be built up for each classroom, which can be analysed for trends. With this valuable data, we can provide feedback to architects and consultants on how building services are operating in comparison to the modelling data. Facilities managers can tweak system parameters to get the exact performance they require in each room. The user will also be able to see how much energy is saved by choosing a naturally intelligent ventilation system.
Proactive maintenance
Connection to the cloud enables us to monitor performance data, enabling us to alert facilities managers if there are any irregularities with the operation of the units, preventing any potential problems. This approach of constant monitoring saves time, money, and reduces the risk of faults which could affect the overall performance of the building.
Remote commissioning
Having a remote connection to the units enables immediate remote commissioning. This ensures that every units can be updated with new software simultaneously without the need for any site visits which save time and money.
Performance Analysis Reports
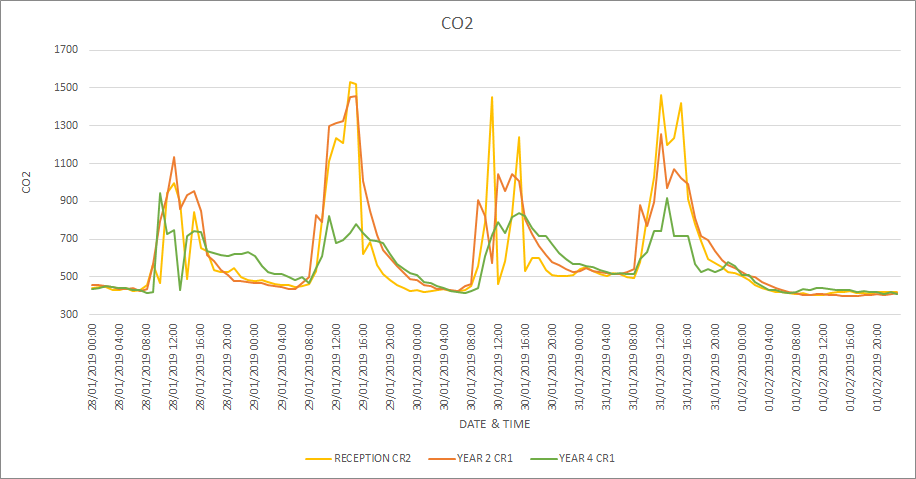
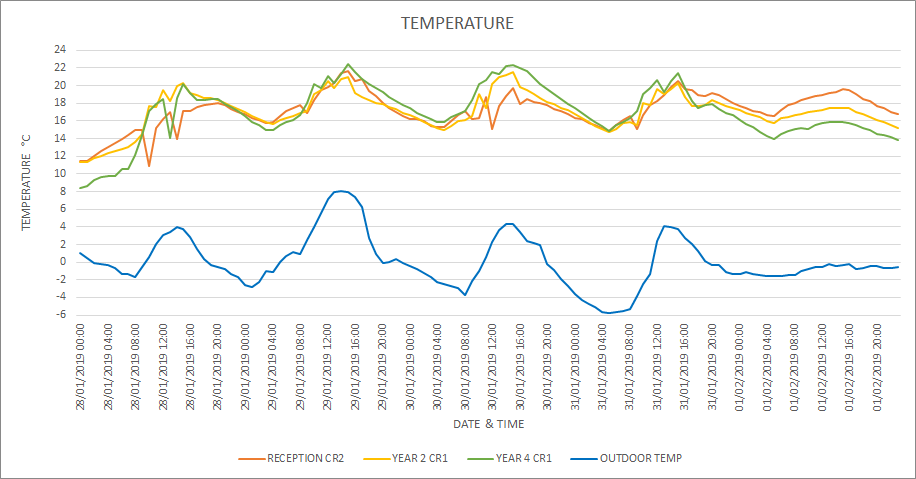
We provide seasonal performance reports to Architects, M&E’s and Facilities Managers so they can review the performance of our systems. The reports show graphs on the CO2 level and the temperature. Information on the average C02 levels during occupied hours are also provided.
Below you can see data from a School in Berkshire, fitted with Ventive’s Windhive systems. This shows a typical week in January when the school was occupied. From the data that was collected and analysed, it shows that the Ventive units have maintained a comfortable indoor temperature and low CO2 level, all within the guidelines of BB101.
CO2
TEMPERATURE
Click here for the full ventilation performance analysis for this school from January – March 2019
If you have any questions or would like further information, please do not hesitate to contact us.